
Hi,
We have been experiencing a memory leak with respect to traffic in a linear fashion. I have tried to take the memory dumps using Pympler, Tracemalloc, and Guppy. The dumps are not helpful wrt to finding the leak and also don’t match with the leaked memory(eg: The dumps say 1M increase where the actual increase in the graphs are 10M).
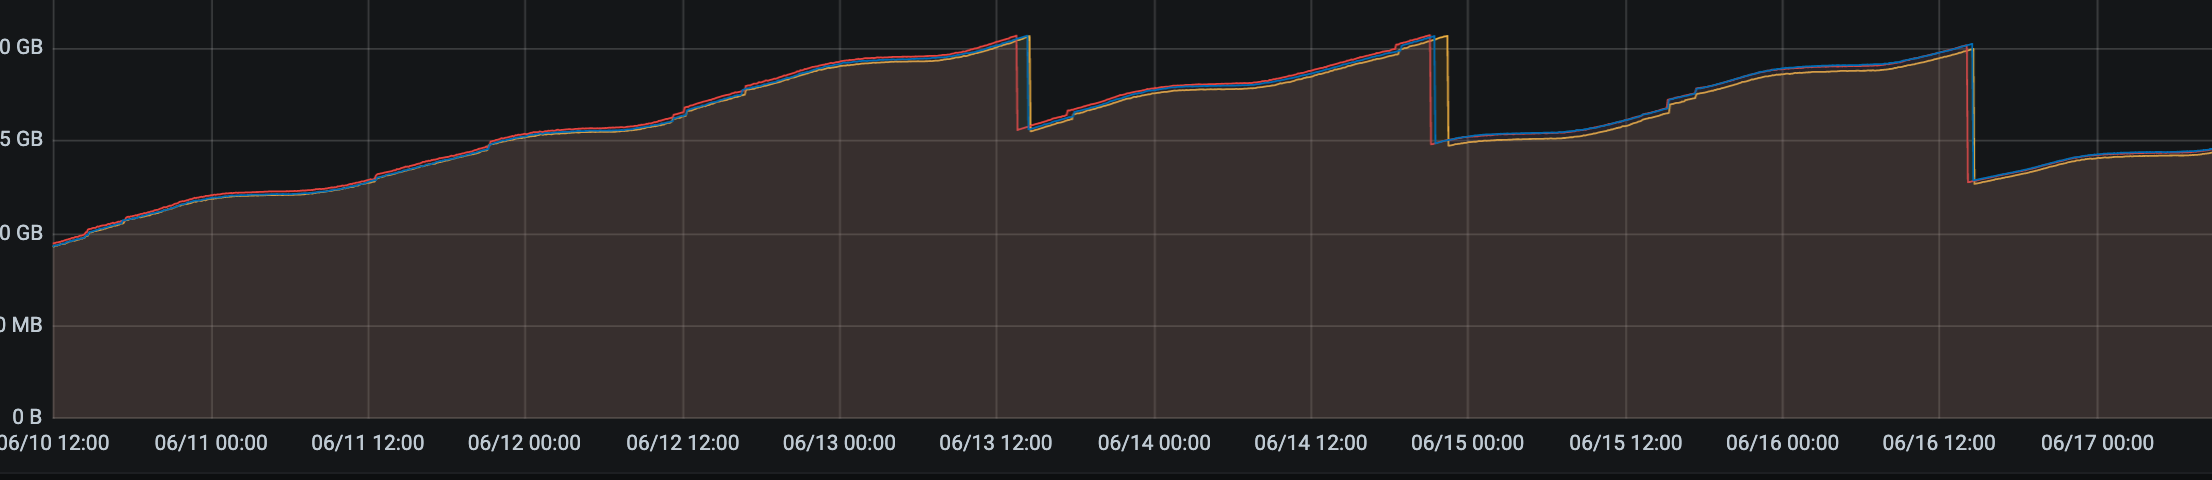
As in the graph, The application won’t die when it reaches the peak memory, It does the GC and frees up some memory.
Sanic Version : sanic==20.6.3
Other dependencies
aioconsole==0.2.1
aiofiles==0.5.0
aiohttp==3.6.2
aiologstash==2.0.0
aiomonitor==0.4.5
aionotify==0.2.0
aioredis==1.3.1
aiotask-context==0.6.1
async-timeout==3.0.1
attrs==19.3.0
Cerberus==1.3.2
certifi==2020.6.20
chardet==3.0.4
cityhash==0.2.3.post9
eventemitter==0.2.0
gc-prometheus==0.1.0
h11==0.9.0
h2==3.2.0
hiredis==1.1.0
hpack==3.0.0
hstspreload==2020.8.18
httptools==0.1.1
httpx==0.11.1
hyperframe==5.2.0
idna==2.10
mem-top==0.1.6
multidict==4.7.6
prometheus-client==0.8.0
python-logstash==0.4.6
PyYAML==5.3.1
pyzmq==19.0.2
rfc3986==1.4.0
sanic==20.6.3
shortid==0.1.2
sniffio==1.1.0
sortedcollections==1.2.1
sortedcontainers==2.2.2
terminaltables==3.1.0
typing-extensions==3.7.4.2
ujson==3.1.0
urllib3==1.25.10
uuid==1.30
uvloop==0.14.0
websockets==8.1
yarl==1.5.1
pytz==2020.1
Please help out if you faced this issue before / suggest a good profiler to track down the leak.
Many Thanks,
Ashok.